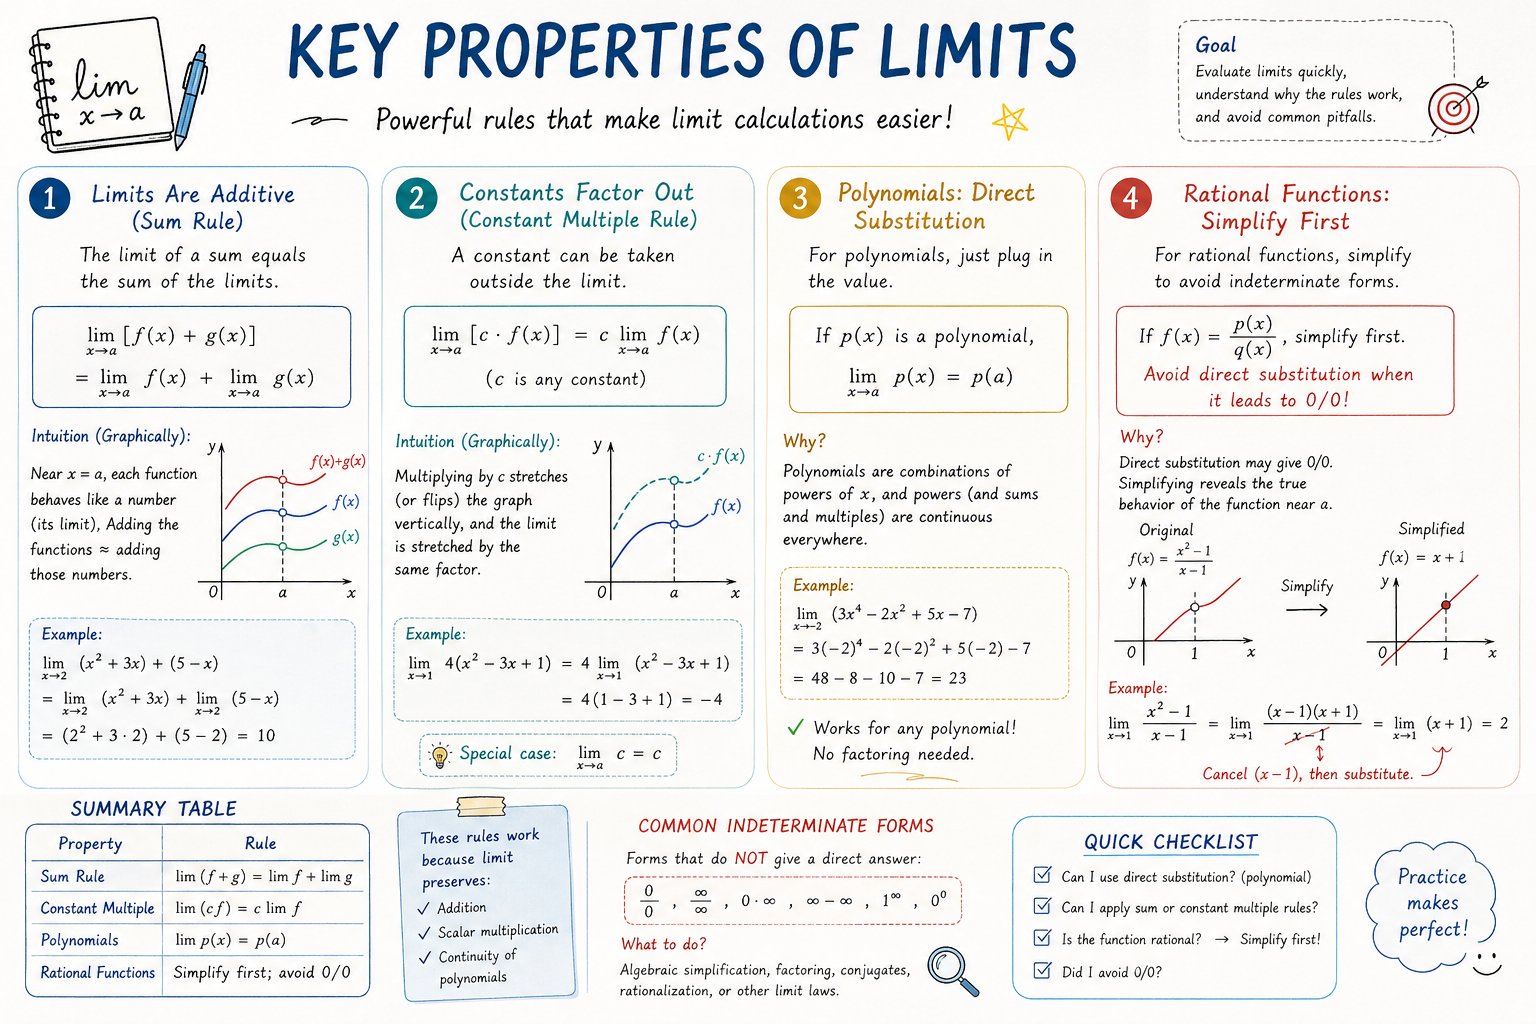
AP Calculus 学习表信息图
Charts & Infographics · UI, Infographic, Poster
使用指南
基于「ap calculus 学习表信息图」生成信息图/知识图解
💡 建议上传一张参考图片(可选),帮助AI更准确地理解你的需求。
💡 针对你描述的建议
- 输入任何可以被结构化展示的知识主题
- 描述你希望的版式和信息密度
- 可以指定配色方案和视觉风格
✨ 参考示例
- 咖啡从种子到杯子的全过程
- 2024 全球碳排放分布图
- 前端框架生态对比
上传参考图可以让 AI 更准确地理解你的创作意图,不传也可以正常生成
点击或拖拽上传参考图片(可选)
支持 JPG、PNG、WebP 格式
请根据提示描述你想要的图像内容,越详细的描述可能生成更好的效果。
低/中质量更快更省积分
Prompt 模板
Please create a mathematical visualization infographic about "[math concept / topic]." The goal is to help the viewer intuitively understand what it is, why it works, its geometric or structural intuition, and how it beh
系统会自动将你的描述插入到模板中
标签
Charts & InfographicsUIInfographicPosterTechCommerceEducation